
[Editor’s Note: This is a republish of an old Ex Situ which was part of a set, but I thought with my addendum that it deserved its own article.]
Yonder at The Minus World, there was a cleverly-conceived, confusingly both underwritten and overwritten, and woefully trying-too-hard-to-be-funny report about the frequency of Princess actualization. The original link seems to be dead, but here is a reprint:
New Haven, Connecticut – Profoundly sidetracked Yale scholars have been working feverishly to determe the statistical accuracy of finding the hypothetically kidnapped Mushroom Kingdom Princess in a castle. It has been agreed that 87.5% of the time, prospective rescuers will not happen upon the Princess and will instead hold a brief conversation with a fungus man who will inform them vaguely that her whereabouts are elsewhere. While probability and numerical accuracy have been officially cemented, researchers remain consistently baffled as to why she keeps getting yanked to begin with, or if the bitch is even worth it at this point.
Addendum: The calculation to find the Princess Probability isn’t even accurate. Taking into account the Warp Zones, there are many different paths Mario might take during the course of the game, each with a different total probability of the Princess being in a castle, hereafter referred to as 
In World 1-2, there is a Warp Zone to Worlds 2-1, 3-1, and 4-1. In World 4-2, there are two Warp Zones, to 5-1, 6-1, 7-1, and 8-1 in toto. So let’s break the Mushroom Kingdom into two sets: A and B, where each possible path to get to World 4-2 is in A and each possible path to get from World 4-2 to the end of the game is in B.
Here is a chart enumerating each path in A, where an “X” indicates a completed castle, 

| Path | World 1 | World 2 | World 3 | NC | NP | Notes |
 |
X | X | X | 3 | 0 | |
 |
X | X | 2 | 0 | Warp from 1-2 to 2-1 | |
 |
X | 1 | 0 | Warp from 1-2 to 3-1 | ||
 |
0 | 0 | Warp from 1-2 to 4-1 |
And a similar chart for set B:
| Path | World 4 | World 5 | World 6 | World 7 | World 8 | NC | NP | Notes |
 |
X | X | X | X | X | 5 | 1 | |
 |
X | X | X | X | 4 | 1 | Warp from 4-2 to 5-1 | |
 |
X | X | X | 3 | 1 | Warp from 4-2 to 6-1 | ||
 |
X | X | 2 | 1 | Warp from 4-2 to 7-1 | |||
 |
X | 1 | 1 | Warp from 4-2 to 8-1 |
So the total number of paths possible is:

(which really is just 
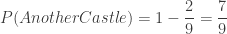
To calculate the probability of The Princess being in another castle, 


(Note that 

So instead of 
Furthermore, since each path has a 


To summarize: on an average full game of Super Mario Bros., one should expect:
- The Princess to be in another castle about 78% of the time
- The Princess to be in another castle 3.5 times
- The Princess to be in a castle 1 time
We here at J. Cart. Overanal. feel this probabilistic description is far superior, assuming we didn’t screw up the math. Comments or complaints about wonky symbol useage are welcome below.


 Posted by The Editor

